Now that I have got your attention with my sales pitch. Let me quote a sales pitch we have heard quite often from Exadata Sales rep “Drop the indexes on Exadata ; It is a magical unicorn and it will guarantee performance even without them” Well, 50 years of computer science begs to differ. This Urban legend has to die for once and all. Indexes are computer science constructs and one of the basics of search optimization.
Hardware like Exadata cannot always be a solution to a Software problem. Exadata though a very well engineered system design to run Oracle database it cannot always compensate for wrong SQL logic. Recently we encountered a issue where a query running in a constant loop was doing lot of user I/O and hence consuming way too much CPU. We decided to dig a little further by getting the execution plan for the query.
Query
[code language="sql"]
SELECT  t.*                          ,
        e.RETURNCODEMSG              ,
        r.RETURNCODE            AS R_RC  ,
        R.RETURNCODEDESC        AS R_RCD ,
        R.RETURNCODEPOVIDER     AS R_RCP ,
        R.RETURNCODEPOVIDERDESC AS R_RCPD
FROM
        (
                SELECT  *
                FROM
                        (
                                SELECT  ROWNUM rown ,
                                        t1.*
                                FROM
                                        (
                                                SELECT  TRAN.*
                                                FROM    transactions TRAN,
                                                        TRANSREVERSED RTRAN
                                                WHERE   RTRAN.LOGREFID(+)    =TRAN.ID
                                                        AND TRAN.UTIMESTAMP >= to_date('26/10/2017', 'dd/MM/yyyy')
                                                        AND TRAN.UTIMESTAMP <= to_date('26/10/2017 23:59:59','dd/MM/yyyy HH24:MI:ss')                                                         AND 1                =1                                                         AND TRAN.SERVICENAME ='STRINGTOSEARCH'                                                         AND TRAN.returncode !='000004'                                                 ORDER BY TRAN.UTIMESTAMP DESC                                         )                                         t1                         )                         q1                 WHERE   q1.rown    >=1
                        AND q1.rown
        )
        t               ,
        TRANSREVERSED r ,
        esbreturncode e
WHERE   r.LOGREFID(+)      =t.ID
        AND e.returncode(+)=t.returncode
ORDER BY t.UTIMESTAMP DESC
[/code]
Now If you analyze the Query, it’s a complex one with Joins on two tables selecting data from table TRANSACTIONS and then doing an inner join on a column in table TRANSREVERSED. The predicate LOGREFID is used for this inner join. In the Explain plan we saw a full table scan being done on the TRANSREVERSED table. Even though the lookup table is small the result set via which it has to be compared is quite huge.
Execution Plan Pre-Index Ethos
[code language="sql"]
<hr />
<p class="x_MsoNormal">| Id  | Operation                          | Name          | Rows  | Bytes | Cost (%CPU)| Time     | Pstart| Pstop |</p>
<p class="x_MsoNormal">--------------------------------------------------------------------------------------------------------------------</p>
<p class="x_MsoNormal">|   0 | SELECT STATEMENT                   |               |    39 | 84786 | 17007   (1)| 00:03:25 |       |       |</p>
<p class="x_MsoNormal">|   1 |  SORT ORDER BY                     |               |    39 | 84786 | 17007   (1)| 00:03:25 |       |       |</p>
<p class="x_MsoNormal">|*  2 |   HASH JOIN OUTER                  |               |    39 | 84786 | 17006   (1)| 00:03:25 |       |       |</p>
<p class="x_MsoNormal">|*  3 |    HASH JOIN RIGHT OUTER           |               |    39 | 80106 |  9053   (1)| 00:01:49 |       |       |</p>
<p class="x_MsoNormal">|   4 |     TABLE ACCESS STORAGE FULL      | ESBRETURNCODE |    76 |  2964 |     4   (0)| 00:00:01 |       |       |</p>
<p class="x_MsoNormal">|*  5 |     VIEW                           |               |    39 | 78585 |  9049   (1)| 00:01:49 |       |       |</p>
<p class="x_MsoNormal">|   6 |      COUNT                         |               |       |       |            |          |       |       |</p>
<p class="x_MsoNormal">|   7 |       VIEW                         |               |    39 | 78078 |  9049   (1)| 00:01:49 |       |       |</p>
<p class="x_MsoNormal">|   8 |        SORT ORDER BY               |               |    39 | 12558 |  9049   (1)| 00:01:49 |       |       |</p>
<p class="x_MsoNormal">|*  9 |         HASH JOIN OUTER            |               |    39 | 12558 |  9048   (1)| 00:01:49 |       |       |</p>
<p class="x_MsoNormal">|  10 |          PARTITION RANGE SINGLE    |               |    39 | 11505 |  1095   (1)| 00:00:14 |    86 |    86 |</p>
<p class="x_MsoNormal">|* 11 |           TABLE ACCESS STORAGE FULL| TRANSACTIONS  |    39 | 11505 |  1095   (1)| 00:00:14 |    86 |    86 |</p>
<p class="x_MsoNormal">|  12 |          PARTITION RANGE ALL       |               | 16278 |   429K|  7953   (1)| 00:01:36 |     1 |1048575|</p>
<p class="x_MsoNormal">|  13 |           TABLE ACCESS STORAGE FULL| TRANSREVERSED | 16278 |   429K|  7953   (1)| 00:01:36 |     1 |1048575|</p>
<p class="x_MsoNormal">|  14 |    PARTITION RANGE ALL             |               | 16278 |  1907K|  7953   (1)| 00:01:36 |     1 |1048575|</p>
<p class="x_MsoNormal">|  15 |     TABLE ACCESS STORAGE FULL      | TRANSREVERSED | 16278 |  1907K|  7953   (1)| 00:01:36 |     1 |1048575|</p>
[/code]
After trying a couple of silly scenarios for tuning it like moving the Table to the flash cache permanently with FLASH_CACHE=KEEP option and trying to ask the developer to reduce the time span for which it searches the first table via field UTIMESTAMP (developers will never admit their code is crappy). Then we went back to the hammer and nails approach. “Why not create an index on the field instead of trying to put a nail through with a Jedi lightsaber !!”
So after a few hours of excersizing our grey cells we created a non-unique b*tree index on the field LOGREFID and rebuild the table stats. The performance of the query immediately saw improvement from consuming a helluva lot user I/O to almost nothing. In case of heavy reads a missing index is almost always the silver bullet.
Execution Plan Post-Index Ethos
[code language="sql"]
<p class="x_MsoNormal">----------------------------------------------------------------------------------------------------------------------</p>
<p class="x_MsoNormal">| Id  | Operation                            | Name          | Rows  | Bytes | Cost (%CPU)| Time     | Pstart| Pstop |</p>
<p class="x_MsoNormal">----------------------------------------------------------------------------------------------------------------------</p>
<p class="x_MsoNormal">|   0 | SELECT STATEMENT                     |               |    39 | 84786 |  1174   (1)| 00:00:15 |       |       |</p>
<p class="x_MsoNormal">|   1 |  SORT ORDER BY                       |               |    39 | 84786 |  1174   (1)| 00:00:15 |       |       |</p>
<p class="x_MsoNormal">|   2 |   NESTED LOOPS OUTER                 |               |    39 | 84786 |  1173   (1)| 00:00:15 |       |       |</p>
<p class="x_MsoNormal">|*  3 |    HASH JOIN RIGHT OUTER             |               |    39 | 80106 |  1127   (1)| 00:00:14 |       |       |</p>
<p class="x_MsoNormal">|   4 |     TABLE ACCESS STORAGE FULL        | ESBRETURNCODE |    76 |  2964 |     4   (0)| 00:00:01 |       |       |</p>
<p class="x_MsoNormal">|*  5 |     VIEW                             |               |    39 | 78585 |  1123   (1)| 00:00:14 |       |       |</p>
<p class="x_MsoNormal">|   6 |      COUNT                           |               |       |       |            |          |       |       |</p>
<p class="x_MsoNormal">|   7 |       VIEW                           |               |    39 | 78078 |  1123   (1)| 00:00:14 |       |       |</p>
<p class="x_MsoNormal">|   8 |        SORT ORDER BY                 |               |    39 | 12558 |  1123   (1)| 00:00:14 |       |       |</p>
<p class="x_MsoNormal">|*  9 |         HASH JOIN OUTER              |               |    39 | 12558 |  1122   (1)| 00:00:14 |       |       |</p>
<p class="x_MsoNormal">|  10 |          PARTITION RANGE SINGLE      |               |    39 | 11505 |  1095   (1)| 00:00:14 |    86 |    86 |</p>
<p class="x_MsoNormal">|* 11 |           TABLE ACCESS STORAGE FULL  | TRANSACTIONS  |    39 | 11505 |  1095   (1)| 00:00:14 |    86 |    86 |</p>
<p class="x_MsoNormal">|  12 |          INDEX STORAGE FAST FULL SCAN| LOGREFID_IDX  | 16278 |   429K|    27   (0)| 00:00:01 |       |       |</p>
<p class="x_MsoNormal">|  13 |    TABLE ACCESS BY GLOBAL INDEX ROWID| TRANSREVERSED |     1 |   120 |     2   (0)| 00:00:01 | ROWID | ROWID |</p>
<p class="x_MsoNormal">|* 14 |     INDEX RANGE SCAN                 | LOGREFID_IDX  |     1 |       |     1   (0)| 00:00:01 |       |       |</p>
<p class="x_MsoNormal">[/code]
Lets look at more graphical representation from OEM ; A picture speaks louder than a thousand words.
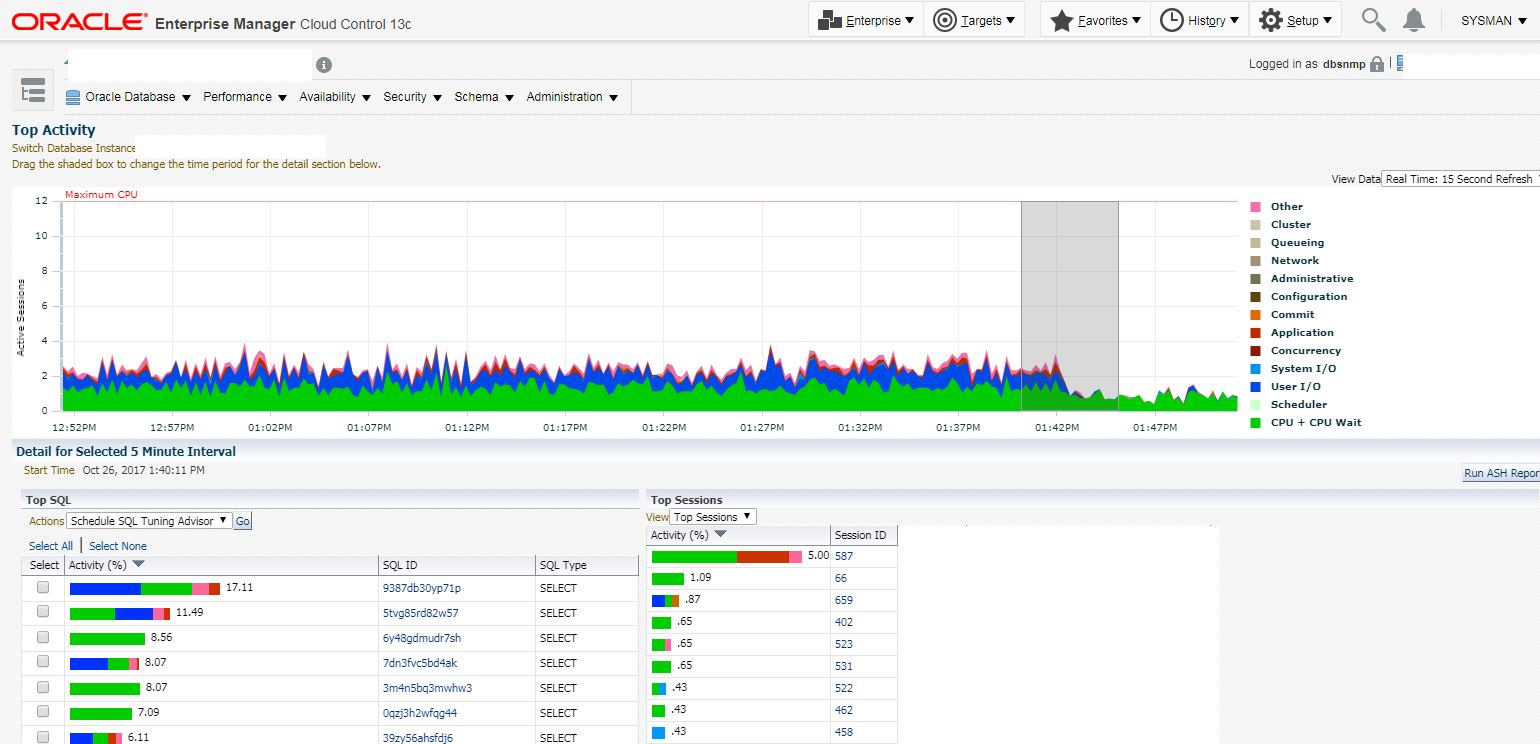
/* The left-side mountain spikes are pre-index ethos and the right side hills are post. Self explanatory */
Heavy reads with high cost screams Index missing. Now this does not mean you go and start creating indexes in every SQL query you see a bit of reads. The Crux of the matter is that before you go ahead and blame your storage admin or disk subsystem or get new hardware. Doing a bit of the basics like looking at AWR reports, generating plans and applying good ol’ DBA intuition, it can do more good than throwing hardware at it. Hardware will never guarantee solution to a software problem.
P.S: We had the above issue on a densely packed Exadata X4-2 Quarter rack sharing 20+ instances. Disk I/O is the number one performance killer on a consolidated platform. Waiting on Disk I/O will always lead to higher CPU consumption.